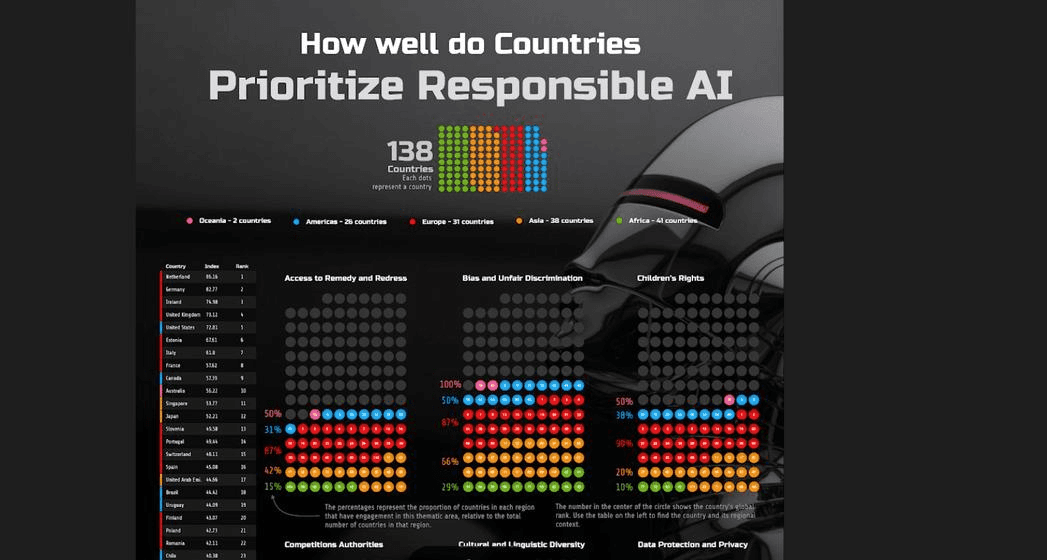
Measuring responsible AI in 136 countries
Explore data. Drive impact. Shape the future of AI

Visualize the Global Landscape of Responsible AI

Join the Global Index on Responsible AI Data Visualization Challenge to transform data into impactful insights on Responsible AI governance worldwide.

Days until submission deadline

3days4hours12minutes19seconds

Register Now

Register Now

About the DataViz Challenge

The GIRAI DataViz Challenge invites you to explore the global landscape of AI governance through the lens of data. Using insights from the Global Index on Responsible AI, participants will create compelling visualizations that uncover key trends, challenges, and disparities shaping Responsible AI worldwide. Your innovative work has the potential to inform policies and practices, driving impactful change in AI governance.

Explore the Global Index on Responsible AI Data

The Global Index on Responsible AI offers a comprehensive dataset spanning 138 countries and jurisdictions, covering 19 thematic areas of Responsible AI. These themes are grouped into broader Dimensions and analyzed through three foundational Pillars, providing a rich, multidimensional perspective on AI governance worldwide. This wealth of data serves as the foundation for your visualization, empowering you to tell powerful stories about AI’s global impact.

Prizes and Rewards

Win big while making an impact- your work deserves the spotlight!

First Prize

$500 Cash Prize
Scholarship
Certificate
Webinar spotlight
Social Media Highlight

Second Prize

Scholarship
Certificate
Social Media Highlight

Third Prize

Certificate
Social Media Highlight

How It Works

Register for the Challenge

Sign up as an individual or team to participate. Be sure to review the challenge guidelines, eligibility requirements, and evaluation criteria to set yourself up for success.

Choose Your Theme

Select from three themes to guide your exploration: focus on key areas shaping Responsible AI, analyze global and regional trends, or uncover unique insights through open exploration.

Access the Data

Gain direct access to the Global Index on Responsible AI dataset and explore its rich, multidimensional insights. Examine diverse thematic areas to uncover inspiration for your visualization.

Create Your Visualization

Use your preferred data visualization tools to craft a compelling visualization. Highlight key findings and align your work with your chosen theme. Be creative, insightful, and impactful in telling your story.

Submit Your Entry

Submit your finalized visualization along with any required documentation by the deadline. Ensure your submission adheres to all formatting and content guidelines.

Winner Announcement

Submissions will be evaluated on creativity, clarity, impact, and alignment with the challenge objectives. Winners will be announced after a single review round, with recognition awarded to individuals or team representatives.

Challenge Timeline

Keep track of important dates, from registration and submission deadlines to the winner announcement.

1

Registration Period
1st Dec 2024 – 20th Jan 2025

2

Welcome Webinar
19th December 2024

3

Newsletter Reminder
3rd January 2025

4

Challenge Submission Deadline
20th January 2025

5

Judging Period
30th January 2025

6

Winner Announcement
30th/31st January 2025

7

Thank You Webinar
31st January 2025

8

Prize Awarding Procedure
30th/31st January 2025

Frequently Asked Questions

Find answers to common questions about the challenge, including participation, tools, and judging criteria.

Who can participate in the challenge?

Who can participate in the challenge?

Who can participate in the challenge?

How will my entry be judged?

How will my entry be judged?

How will my entry be judged?

Is there a registration fee?

Is there a registration fee?

Is there a registration fee?

Do I need prior experience in data visualization to join?

Do I need prior experience in data visualization to join?

Do I need prior experience in data visualization to join?

Are there specific tools I must use to create my visualization?

Are there specific tools I must use to create my visualization?

Are there specific tools I must use to create my visualization?

Ready to make an impact?

Sign up now to join the GIRAI DataViz Challenge and showcase your creativity in shaping the future of Responsible AI!

Register Now

Register Now